
It’s rough out there on the mean streets of the internet. Application’s invariably run into exceptions. Some are expected, most are unexpected, and either way, they’re unwanted. Oban jobs are no, er, exception—anything doing the real work of running queries, interacting with data, and making requests to the badlands of external networks is guaranteed to hit some snags.
Most production apps, at least those ran by people that care about their well-being, use an error monitor like Sentry, HoneyBadger, AppSignal, etc. to notify attentive devs when an error occurs.
For Oban, identifying precisely which job generated which error can be difficult without additional context and some custom grouping. Error reporters are tailored toward reporting errors for web requests or more blatant exceptions. Fortunately, with a few careful reporting tweaks, we can make job error reports just as detailed and actionable.
🙋 Why Focus on Sentry?
This article uses Sentry for its examples because it’s the most widely used official Elixir client. AppSignal and HoneyBadger are excellent alternatives with comparable mechanisms for all of the tips shown below.
Attaching the Error Handler
The standard Oban playbook outlines how to report exceptions via a standard telemetry event. Oban Pro makes it easier, and more reliable, with a global work hook. In either case, you have all the necessary information normalized and ready to report.
A basic handler looks something like this:
def handle_event([:oban, :job, :exception], _measure, %{job: job}, _conf) do
  %{reason: exception, stacktrace: stacktrace} = job.unsaved_error

  Sentry.capture_exception(exception, stacktrace: stacktrace)
end
Error details including the reason, kind, and stacktrace are stored in a job’s virtual
unsaved_error field. That’s ultimately what is formatted and stashed in the errors
field that’s saved to the database. The same fields are available in the telemetry event’s meta,
but pulling it from unsaved_error works with a global hook as well.
Returned tuples like {:error, :boom} or {:cancel, :boop} are standardized as a
Oban.PerformError and crashes are converted to an Oban.CrashError.
Normalization makes reporting simpler and removes the need to carefully inspect the error for
reporting. It also means we can always use Sentry.capture_exception/2, because all error
reasons are converted to exceptions. Unfortunately, normalization can also lead to incorrectly
grouping unrelated exceptions together.
Fingerprinting Errors
Exceptions with the same name, no stacktrace, and slightly differing messages look the same to an error reporter. From the Sentry docs on error grouping:
By default, Sentry will run one of our built-in grouping algorithms to generate a fingerprint based on information available within the event such as
stacktrace,exception, andmessage.
Without better hinting you’ll find yourself with thousands of unrelated PerformError reports
from various jobs all grouped together when they don’t have anything in common. That’s not
helpful. It makes debugging harder and masks real errors since you only receive an email on an
error’s first occurrence.
That’s why Sentry, and other error reporting tools, provide a fingerprint parameter to
give hints to the service about how things should be grouped together. A fingerprint built from
the job’s worker and the exception module is granular enough to separate the same error from
different workers:
fingerprint = [inspect(exception.__struct__), inspect(job.worker)]
# ["Oban.PerformError", "MyApp.BusinessWorker"]
However, in jobs that make liberal use of error tuples, the exception will always be
Oban.PerformError, and we can use the exception’s message to be more specific:
fingerprint = [
  inspect(exception.__struct__),
  inspect(job.worker),
  Exception.message(exception)
]
# ["Oban.PerformError", "MyApp.BusinessWorker", "record not found"]
Now add the fingerprint to the context options:
opts = [fingerprint: fingerprint, stacktrace: stacktrace]

Sentry.capture_exception(exception, opts)
Additional Context
Distinguishing between different error notifications is a start. The next step is injecting more
contextual details into those notifications to help diagnose the issue and drill down to the root
cause. The primary mechanisms for better context are extra and tags maps.
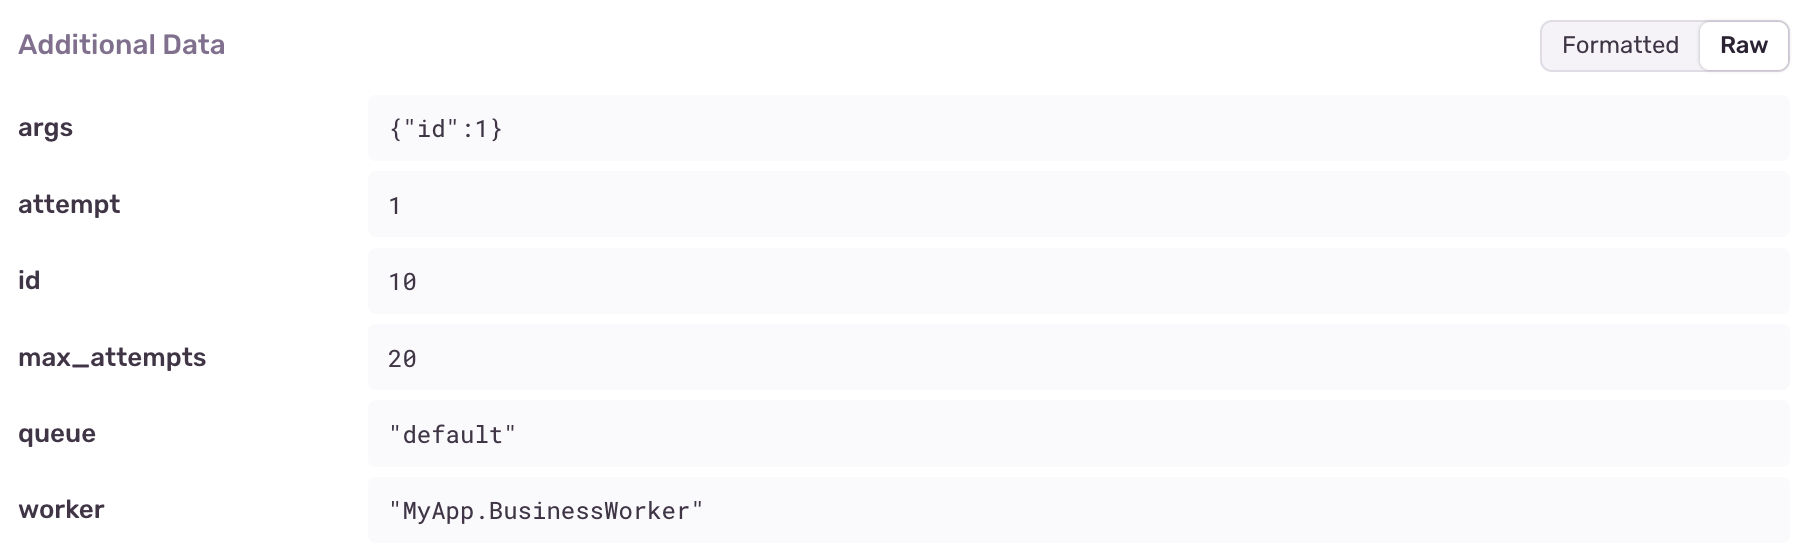
The extra map is for custom, structured data. We can slice off a portion of the job’s
fields and pass those along. Any fields that will help identify the job and recognize a pattern
are candidates for the extra map:
extra = Map.take(job, ~w(args attempt id max_attempts meta queue tags worker)a)
opts = [extra: extra, fingerprint: fingerprint, stacktrace: stacktrace]

Sentry.capture_exception(exception, opts)
The extra fields are now shown in each report:
Grouping with Tags
Tags are an even better way to identify related events because they’re indexed and
searchable. Fields like worker and queue, that are shared among many jobs, are perfect for
tags.
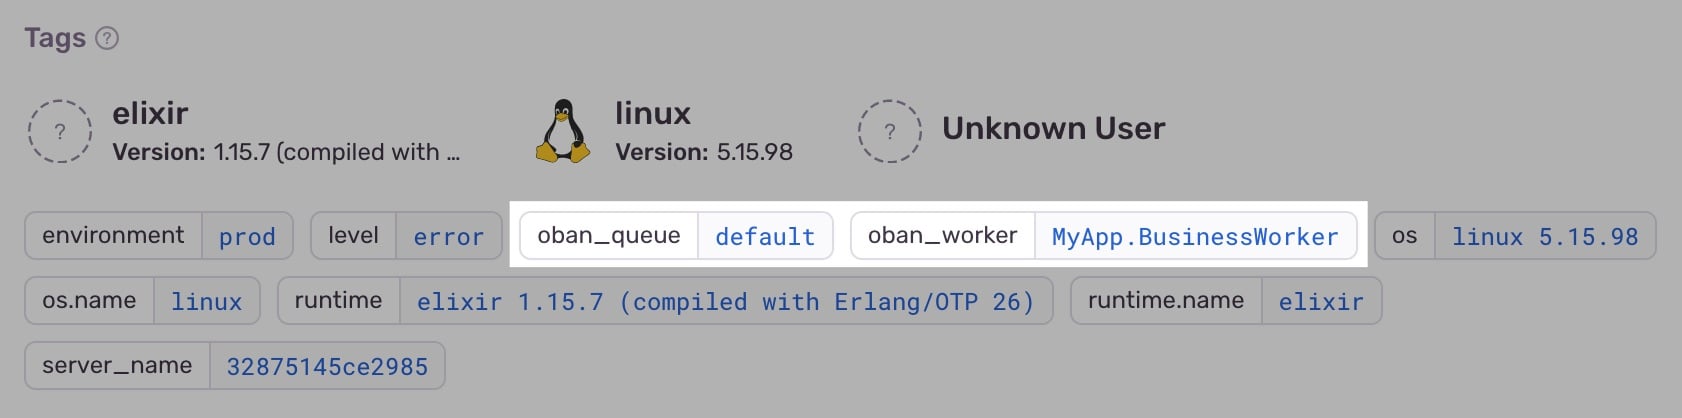
tags = %{oban_worker: job.worker, oban_queue: job.queue, oban_state: job.state}
opts = [extra: extra, fingerprint: fingerprint, stacktrace: stacktrace, tags: tags]

Sentry.capture_exception(exception, opts)
While there’s little chance the names will conflict with existing tags, prefixing them with
oban_ keeps them grouped and distinct. Now the tags are displayed with the runtime and server
information:
Consistent Stacktraces
Erlang/Elixir stacktraces are a finicky beast due to tail call optimization and automatic
truncation. They’re elusive outside of a catch block. A useful stacktrace is only provided
when an exception or crash is caught. Error tuple returns don’t have any associated stacktrace,
and we can’t retrieve one that’s of any use.
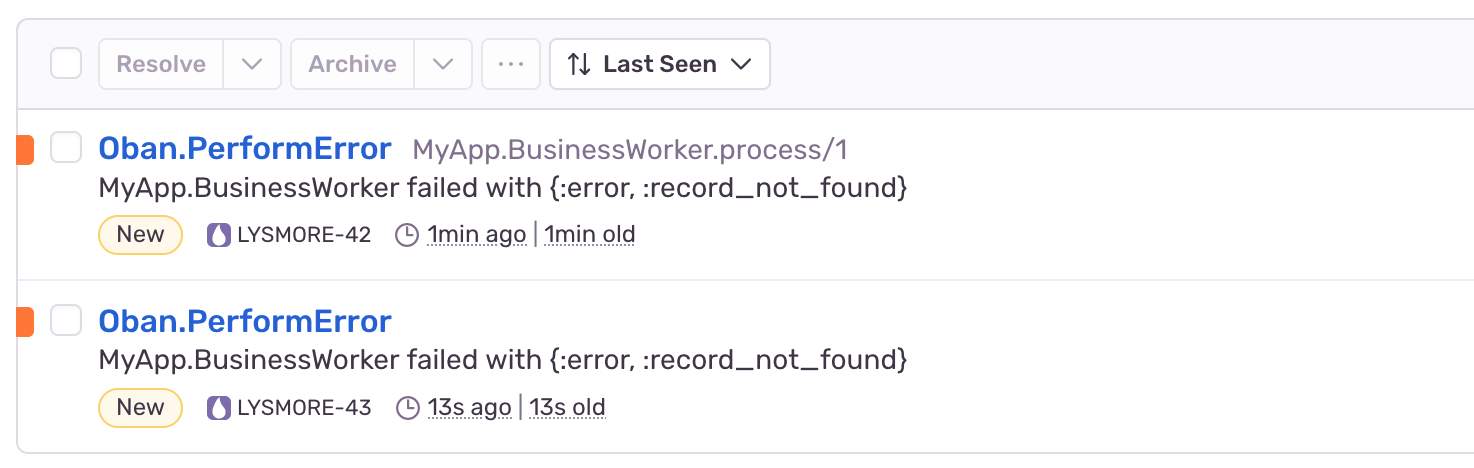
Sentry, and other reporters, show the last stacktrace entry in the report title. Fortunately, all
we really need is an entry for the worker and process/1 (or perform/1 for standard workers),
which is trivial to build manually:
stacktrace =
  case {Oban.Worker.from_string(job.worker), stacktrace} do
    {{:ok, worker}, []} -> [{job.worker, :process, 1, []}]
    _ -> stacktrace
  end
Sentry requires that the first element of a stacktrace is a module, aka an atom. Note the use of
from_string/1 to safely convert the worker string to a module name while guarding against a
missing module.
Having a relevant stacktrace entry makes it possible to spot the worker while scanning through notices. In the screenshot below, the top entry has a trace and the bottom doesn’t:
Finishing Up
Perhaps you’re thinking “those are all useful tips, why not make a library out of it and save us some time?” Well, there are many error reporting services out there, and we don’t want to play favorites too much.
Besides, there are different takes on the exact components of a fingerprint, various approaches toward tags, and you may have additional context that’s important to submit. A one-size-fits-all solution would be limiting.
Appendix: Putting it All Together
Here’s one last example that puts all the tips together in a single block you can use as a starting point:
def handle_event([:oban, :job, :exception], _measure, %{job: job}, _conf) do
  %{reason: exception, stacktrace: stacktrace} = job.unsaved_error

  fingerprint = [
    inspect(exception.__struct__),
    inspect(job.worker),
    Exception.message(exception)
  ]

  stacktrace =
    case {Oban.Worker.from_string(job.worker), stacktrace} do
      {{:ok, worker}, []} -> [{job.worker, :process, 1, []}]
      _ -> stacktrace
    end

  extra = Map.take(job, ~w(args attempt id max_attempts meta queue tags worker)a)
  tags = %{oban_worker: job.worker, oban_queue: job.queue, oban_state: job.state}
  opts = [extra: extra, fingerprint: fingerprint, stacktrace: stacktrace, tags: tags]

  Sentry.capture_exception(exception, opts)
end
As usual, if you have any questions or comments, ask in the Elixir Forum or the #oban channel on Elixir Slack. For future announcements and insight into what we're working on next, subscribe to our newsletter.